This file has been generated from the following notebook: example.ipynb.
Download it if you want to replay it using jupyter notebook.
Notebook Example, Main Title
Some summary
subtitle
Easy to read documentation
Create variables
from math import pi, sin
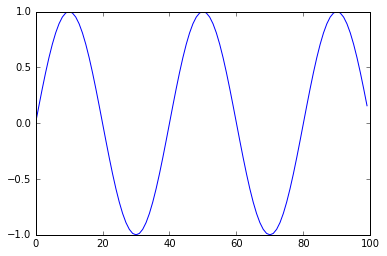
x = range(100)
y = [sin(v * pi / 20) for v in x]
Display
%matplotlib inline

import matplotlib
import matplotlib.pyplot as plt

plt.plot(x,y)
[<matplotlib.lines.Line2D at 0x7f04d057ad90>]